How we use data: To learn from a metric, break it apart
This is the second in a series of posts from Typekit’s resident data analyst, Mike Sall. Read the first.
One of the trickiest questions we can ask of data is how to compare a bunch of smaller items all at once. It’s also one of the most common questions, whether we want to analyze online advertisements, or understand different products, or compare customer segments by region. And to find an answer, we usually end up doing the same thing every time: we’ll take that list of items and rank them by some important value. For example, which online advertisements have the highest click rate? Or which products are purchased the most often? Or what are the top regions by revenue?
It’s an easy way to quickly see what’s important, which is why we do it. But rankings also obscure all the details that can help us figure out what to actually do about those important items. If we know which products are purchased most often, how can we tell whether it’s due to pricing, or features, or marketing? What we really need is to be able to discover trends — not just single numbers — that in turn reveal how we should act upon them.
In our last post on data we discussed one technique for analyzing trends, by visualizing one metric across other dimensions, such as the cancellation rate across time and period of use. This is great when examining the customer base as a whole or considering just a few segments, but it starts to break down when we try to compare dozens or even hundreds of segments at the same time; many graphs all together can be as opaque as the original data. So we need a new technique when we want to explore many segments at once.
To explain our approach, let’s use an example applicable to anyone with a website: traffic sources. We care about traffic sources because if we can better understand who’s sending us new users, we can better serve those users. Most tools like Google Analytics offer lots of data about traffic sources. For each source we can consider a range of metrics, from the number of visitors, to how long they spend on the site, how many of them sign up, and more.
To get to the trends we care about, though, we need to take a step back. First, we should focus our attention on the single most important metric; then, to find the trends, we can take that metric and break it apart — that is, we can look at its components. While the overall metric can help us understand which items are most important, its components will tell us why they are important.
For many online businesses like us, that key metric for web traffic is straightforward enough: revenue. Of course all of the other metrics around engagement are important too, but ultimately we hope traffic will drive people to sign up and purchase a plan.
With this metric in hand, we can now break it apart. To do that, let’s walk through the thought process for visitors purchasing a plan. First, they’ll decide to visit our site. Then, after browsing around, they’ll determine we fit their needs and decide to sign up for a plan. And lastly, they’ll look at the plans we offer and decide which plan they want. So, to understand how traffic sources are driving revenue, we can think about this metric in terms of the sub-decisions that comprise it: visits from the traffic source, then sign-ups from those visits, and then revenue from those sign-ups. Viewing the components in this way produces a nifty equation:
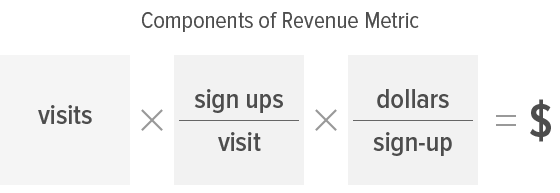
Now we can start to plot our segments (that is, the traffic sources) against these component values. In this case, we went with the following bubble chart:
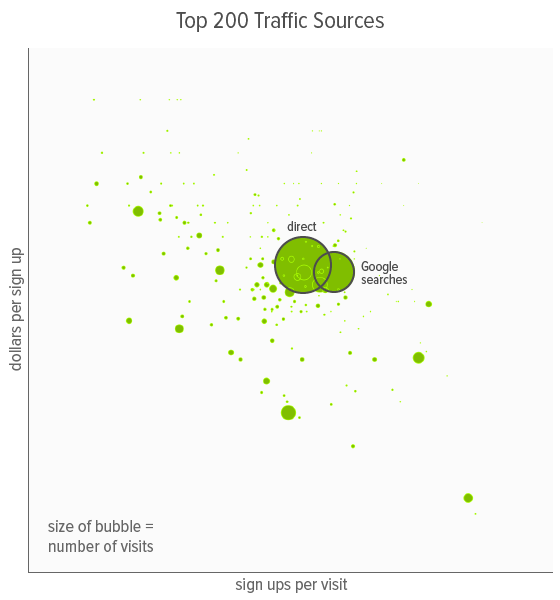
In this chart, we’re plotting the 200 traffic sources that drive the most revenue for us — together, they represent over 95% of our online revenue. The x-axis represents the percent of visitors for each traffic source who signed up for a plan. The y-axis represents the revenue we received per sign up, on average. And the size of the bubble represents the total number of visitors. We also graphed both the y-axis and x-axis along a logarithmic scale, equally spacing 1, 10, 100, and so forth. Depending on the data, logarithmic scales can work better in cases like this, when larger values are spaced further and further apart from each other.
Immediately, we can see that traffic from direct visits and Google searches dwarf our other traffic sources in terms of total visits (and consequently, total revenue as well). They are also somewhat further to the top right than average, which means they achieve higher revenue per visit. This makes sense: visitors who are ready to make a purchase or know what they want are more likely to search for related terms or seek us out directly. Those bubbles are so big, though, that they’re hiding differences among the other sources. We can remove these two data points to see a clearer picture of the remaining traffic sources:
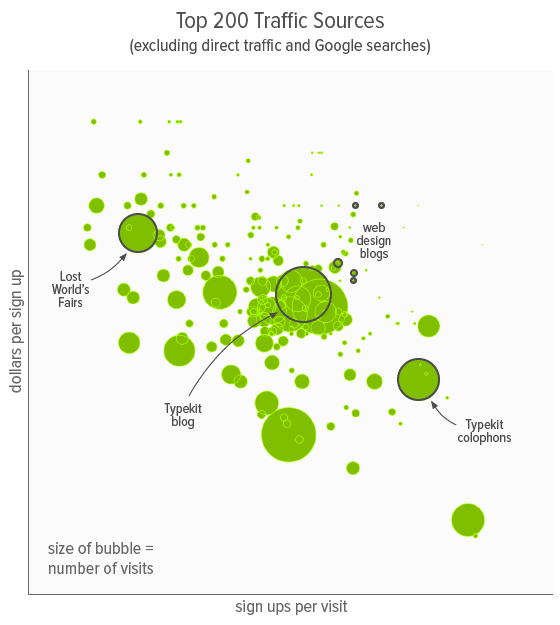
Now we can dig into what the chart shows us about these segments. Take the visitors arriving from Typekit colophons, for example, where a high volume of visitors and strong sign up rates are bolstering a relatively low proportion of paid plans. This tells us that to increase revenue here, we want to focus on improving the proportion of paid plans. That might mean reexamining how we’re presenting the benefits of each plan or perhaps how we’re directing these visitors through the sign-up flow. On the other hand, the Lost World’s Fairs traffic source has the opposite problem — plenty of traffic and a decent proportion of paid plans, but not many sign ups per visit. We know, then, that we should focus on sign up rates for this segment, perhaps through custom landing pages. And lastly, we can see that several web design blogs are sending quality visitors, with both strong sign up rates and a large proportion of paid plans, but in low volume. So perhaps we can advertise on sites like these to increase overall traffic.
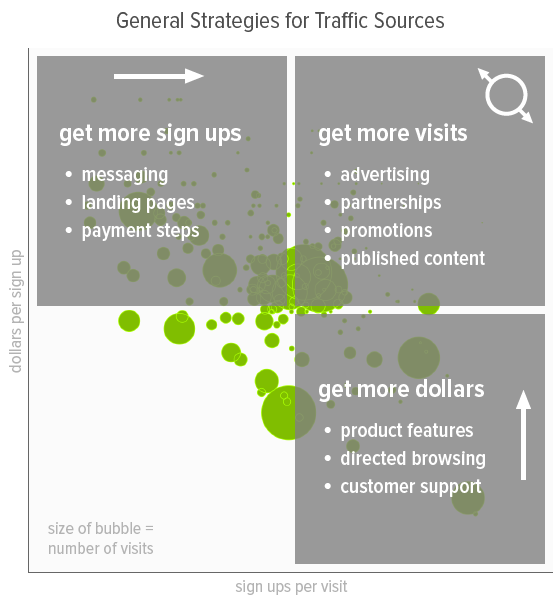
These are all insights a ranking could never reveal. With this new view, we’ve moved past simply figuring out what’s important to thinking about what we can actually do. We can even draft broad strategies tailored to different areas of the chart:
Examining segments in context like this can also help show when certain opportunities stand out. When we did this analysis last summer, we were pleasantly surprised by how well our blog was performing. In addition to decent traffic volume, both the sign up rate and paid plan proportion were higher than average. So we decided to invest in the blog and prioritized several design and content changes.
To better integrate the blog and encourage more browsing into the Typekit site, we added our site-wide navigation to the blog header. To increase sign up rates, we improved our promotional material, including a more prominent message box in the top right and a new footer, as well as a list of recent fonts in the right sidebar. We also thought more about the content. Realizing that posts about new fonts were driving strong traffic, we made them even better. We put more time into making our font specimen images larger and more colorful, and we started suggesting font pairings as well. We also introduced a new series of posts, About Face, where we could feature more content like this. Here’s a brief look at the before and after:

The former blog design.

The new (current) blog design.
It paid off. Before we made those changes, 9% of visitors to our blog were clicking into typekit.com, leading to 4 cents in revenue per blog visit. Today, 27% click into typekit.com, and we see 10 cents in revenue per blog visit. Added to increased traffic overall, our blog is now driving about 190% more revenue per month.
Of course, we didn’t necessarily need the chart to know we could improve our blog. We’re always aware of lots of things we’d like to do when we can get around to it. But we do need charts like this to make sense of our options — to understand how they relate to each other so we can make better decisions about our priorities and approach. That’s where this technique is most beneficial. By simplifying our focus to one metric and then looking at how it breaks apart, we can see which items have the most potential, learn what specific areas need attention, and think of smarter ways to improve.
Together with the technique described in our last post, these methods can help us dive into our data and explore what insights it has to offer. It’s a process that involves asking general questions and looking at what happens when we spread the answer out in different ways. But just as important as it is to begin with questions and dive deeper, we also need to constantly monitor activity at a higher level so we can quickly catch when issues arise. In our next post, we’ll discuss our approach to dashboard metrics and how we go about building team-wide transparency into what’s happening with our users and product on an ongoing basis.
One Response
Comments are closed.
Amazing as always, guys! I love the way you use your own organization as a framework to examine behavioral phenomena — it is truly fascinating.
As a student of behavioral modeling, I hope you’ll answer a random question for me. What kind of bottled water do you have at the Typekit HQ? Do you have a cooler, which offers economies of scale and promotes social interactions, or smaller bottles, that allow for individual tastes? I’d love it if you’d write an entire blog post about this.